Week 2
| Class | C1W2 |
|---|---|
| Created | |
| Materials | https://www.coursera.org/learn/neural-networks-deep-learning/home/week/2 |
| Property | |
| Reviewed | |
| Type | Section |
Lesson 2: Logistic Regression as a Neural Network
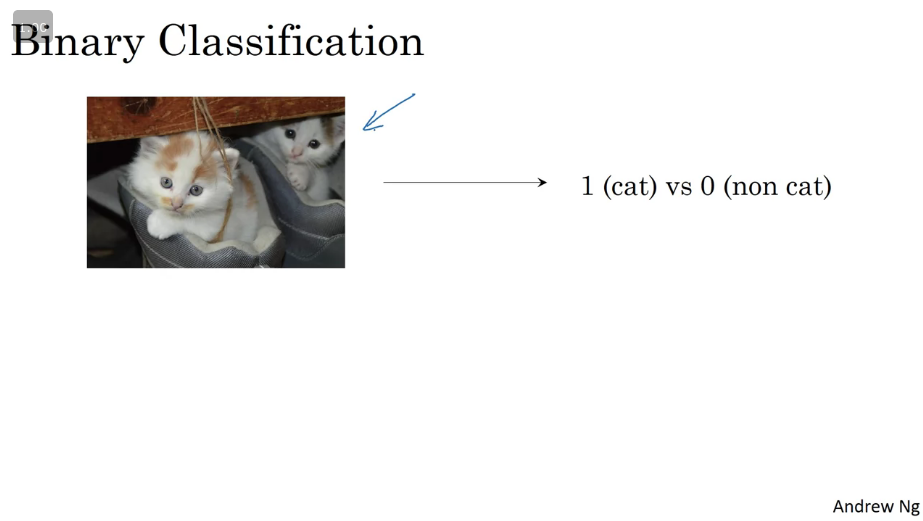
Binary Classification
Logistic Regression is an algorithm for binary classification. Let's take this as an example, you might have an input of an imae, like the one below and would want to output a label that would recognise the content of the image as being a cat or not-a-cat, in which case the output would be 1 if it is a cat and 0 if it is not a cat.
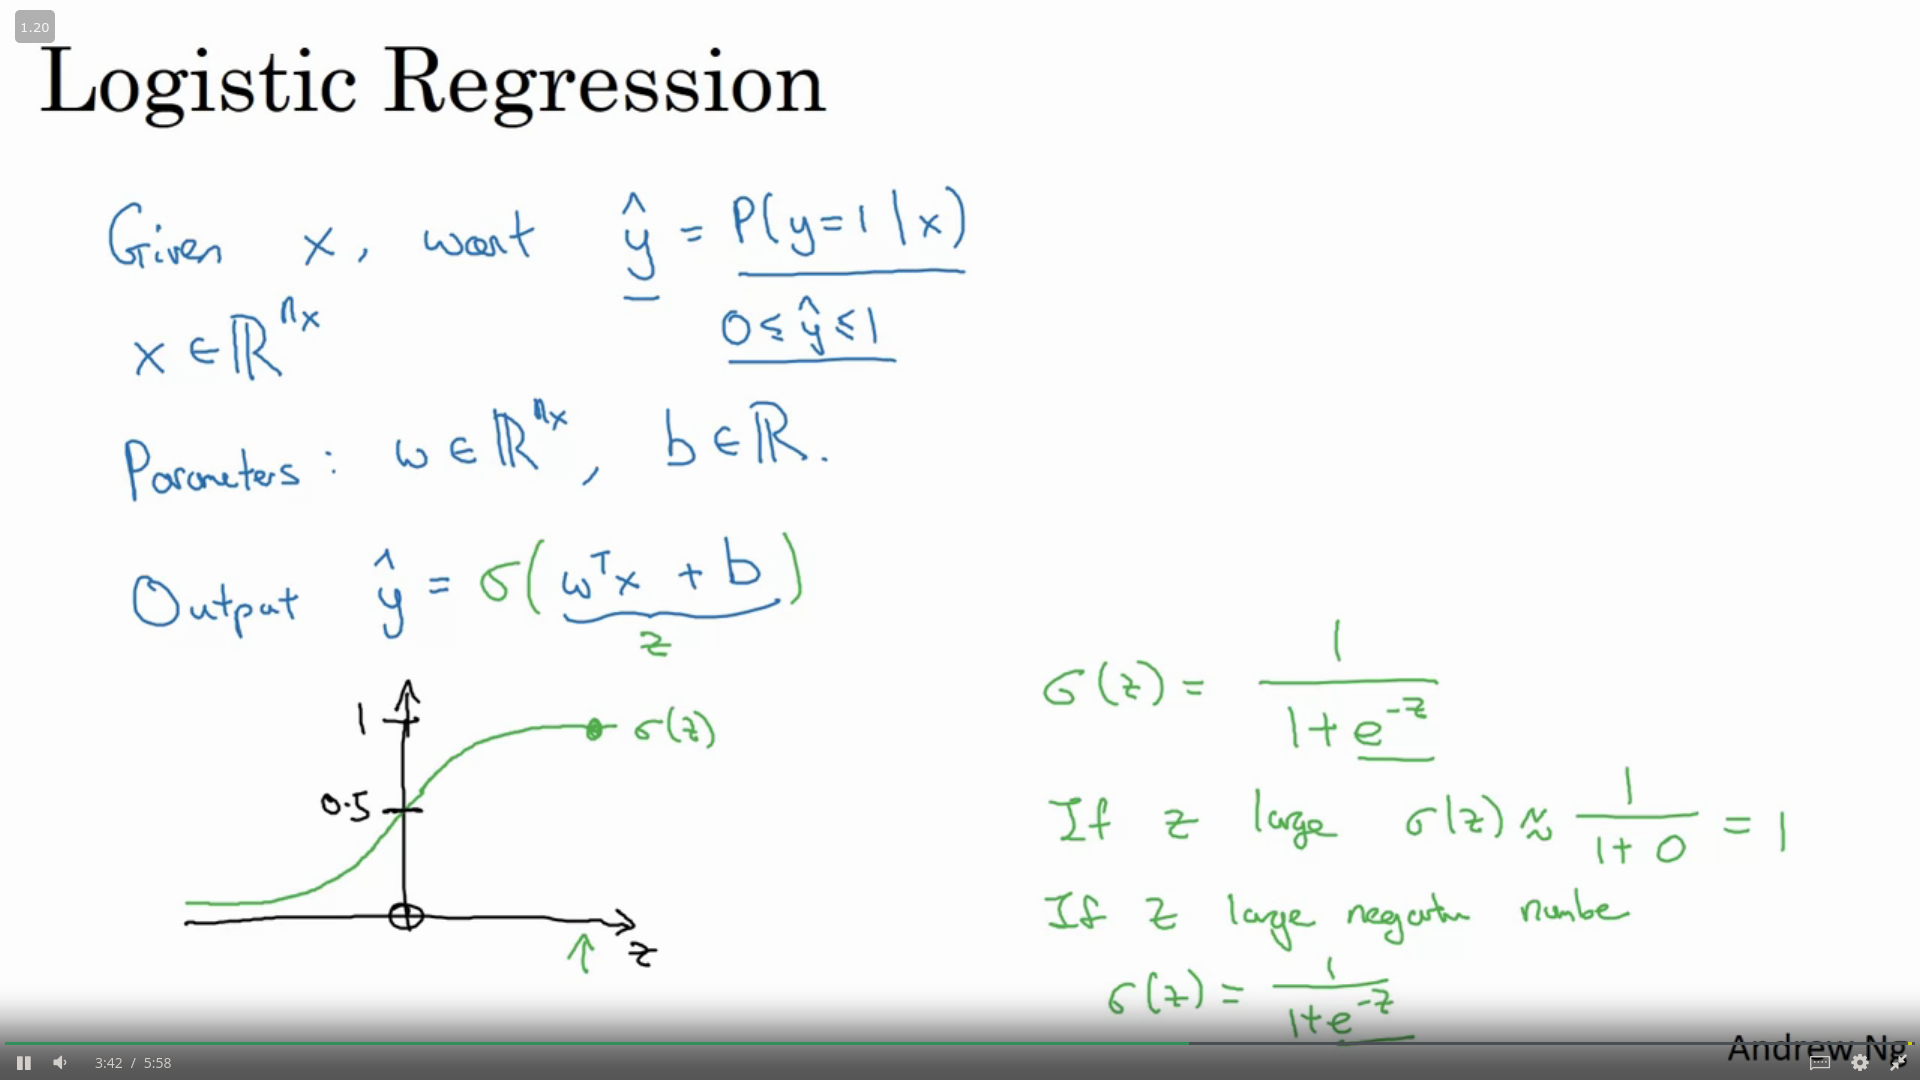
Logistic Regression
This is a learning algorithm that you use when the output labels Y in a supervised learning problem are all either zero or one, which is binary classification.
Fot the example below, given an input feature vector (corresponding to an image you want to recognise), you would want an algorithm that can ouput the prediction, which we'll call which is the probability that the image is of a cat or not.
Therefore our equation would be function as shown in the image below.
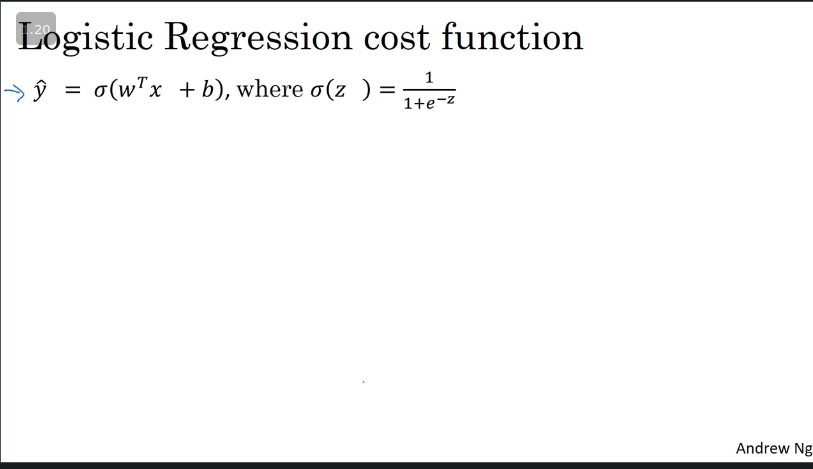
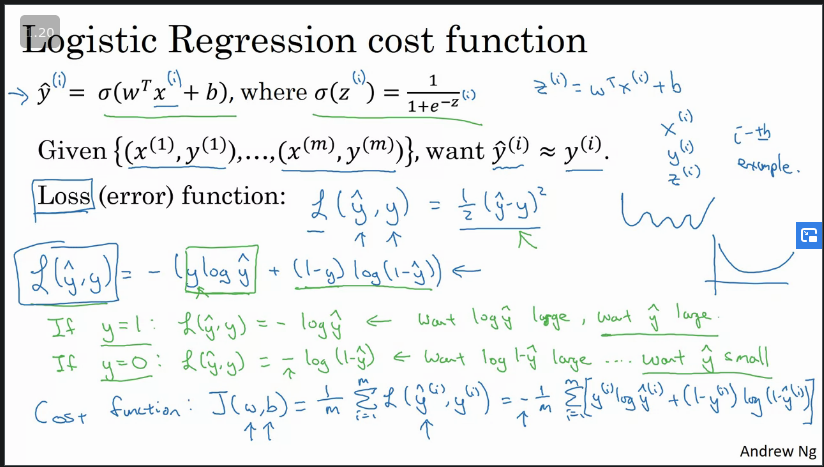
Logistic Regression Cost Function
As defined above, to detemine your bias and weights you need to define a cost function.
In order to measure how well our Yhat function is doing we use the Loss (error) function*, as shown below. This function measures how well you are doing on a single training example.
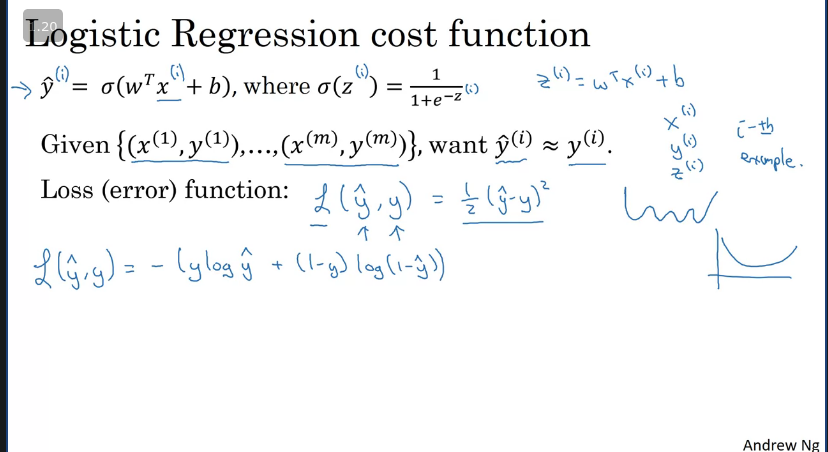
The cost function, however measure how you are doing on an entire training set (parameters in your algorithm).
Q&A:
What is the difference between the cost function and the loss function for logistic regression?
- The loss function computes the error for a single training example; the cost function is the average of the loss functions of the entire training set.
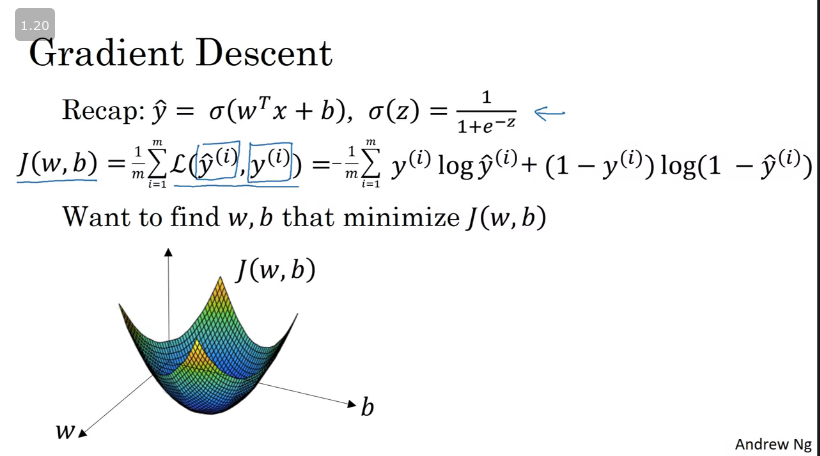
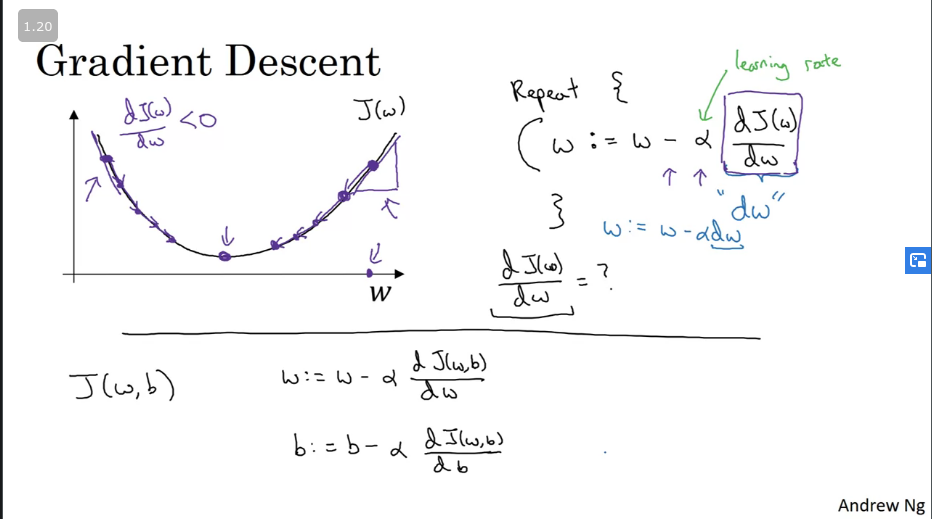
Gradient Descent
Simple illustration of gradient descent is shown in the image below, where the horizontal axes represent the spatial parameters and . can be higher dimensional but for the purpose of plotting, we can illustrate it as a single real number and as a single real number as well. The cost function J(w,b,) is, then, some surface above these horizontal axes w and b. So the height of the surface represents the value of J(w,b) at a certain point. And what we want to do is really to find the value of w and b that corresponds to the minimum of the cost function J.
The equations for finding the value of and are listed below.
Where and w
Q&A: A convex function always has multiple local optima [False]
Derivatives
Key take away FYI: Derivatives == Slope
The slope of the function can be different values depending where it is measured on the graph.
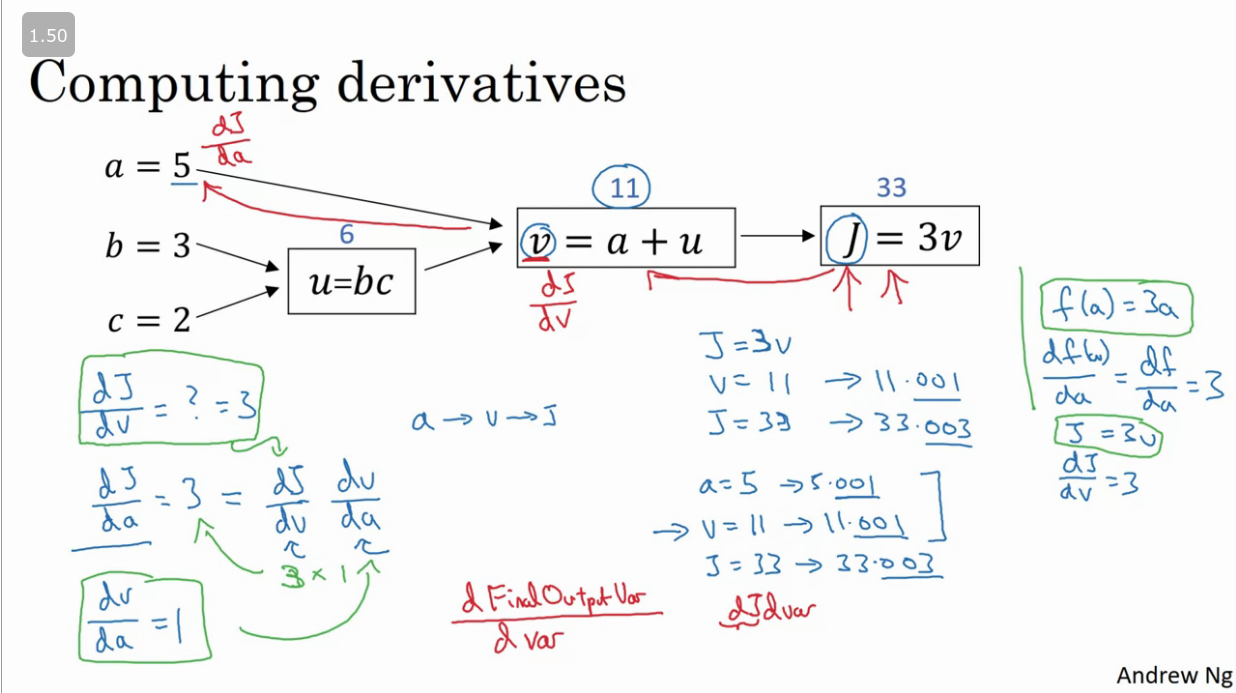
Computational Graph
Computations in neural network consist of a forward pass/forward propagation step in which the output of the neural network is computed and followed by a backward pass/back propagation step.
A simple example of a computational graph is show below:
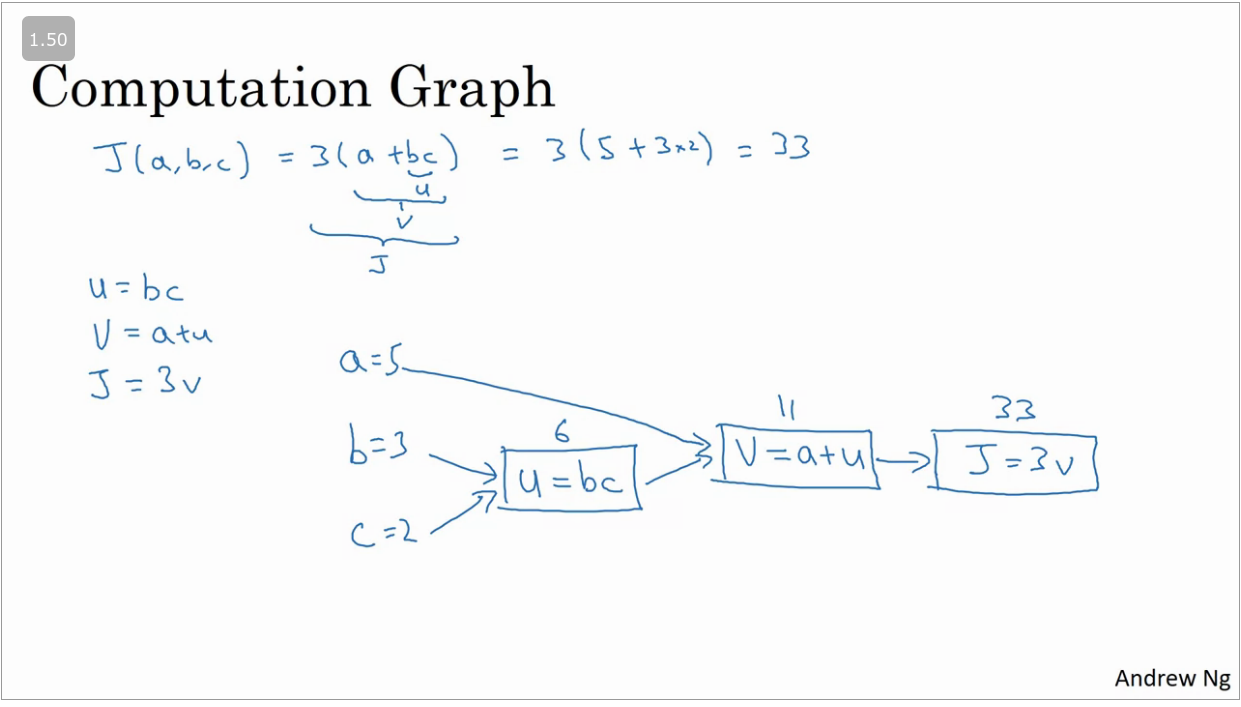
From the example above we can compute the value of by means of a foward pass, but in order to compute the derivative we would need to do a back propagation pass (right → left) as show below.
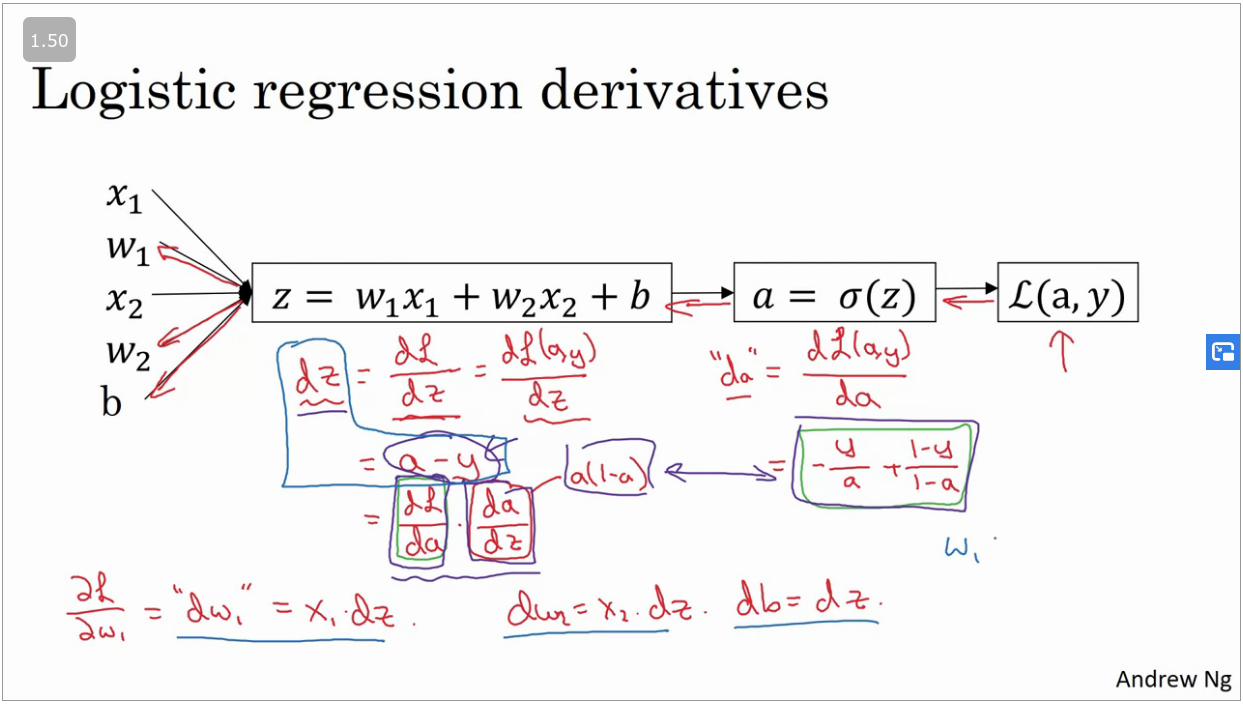
Logistic Regression Gradient Descent
Detailed video on how to calculate
Inorder to do gradient descent using logistic regression you would compute and using the equestions highlighted below.
dz = a -y = sigm(z) - y
Vectorization
Vectorization is the art of getting rid of exlicit for loops in your code. In deep learning you find yourself training large data sets which need to be optimised instead of training in for loops we use vectorization.
In vectorization we would compute matrix multiplacation by means of using numpy. eg:
Simple example illustrating the perfomance of vectorization as compared to native looping implementation.
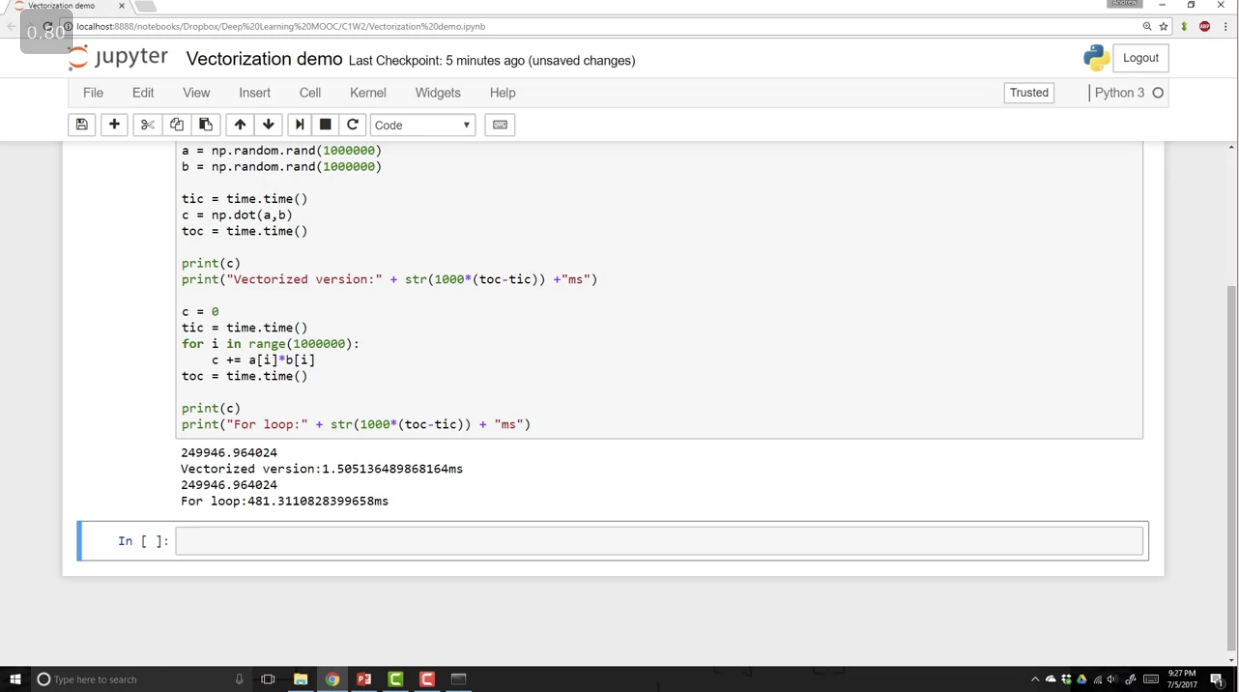
Whenever possible, avoid explicit for loops